my first paper

Author

Kevin Hu

introduction

literature

case analysis

preparation

scatter

```{r}
#| label: fig-scatter
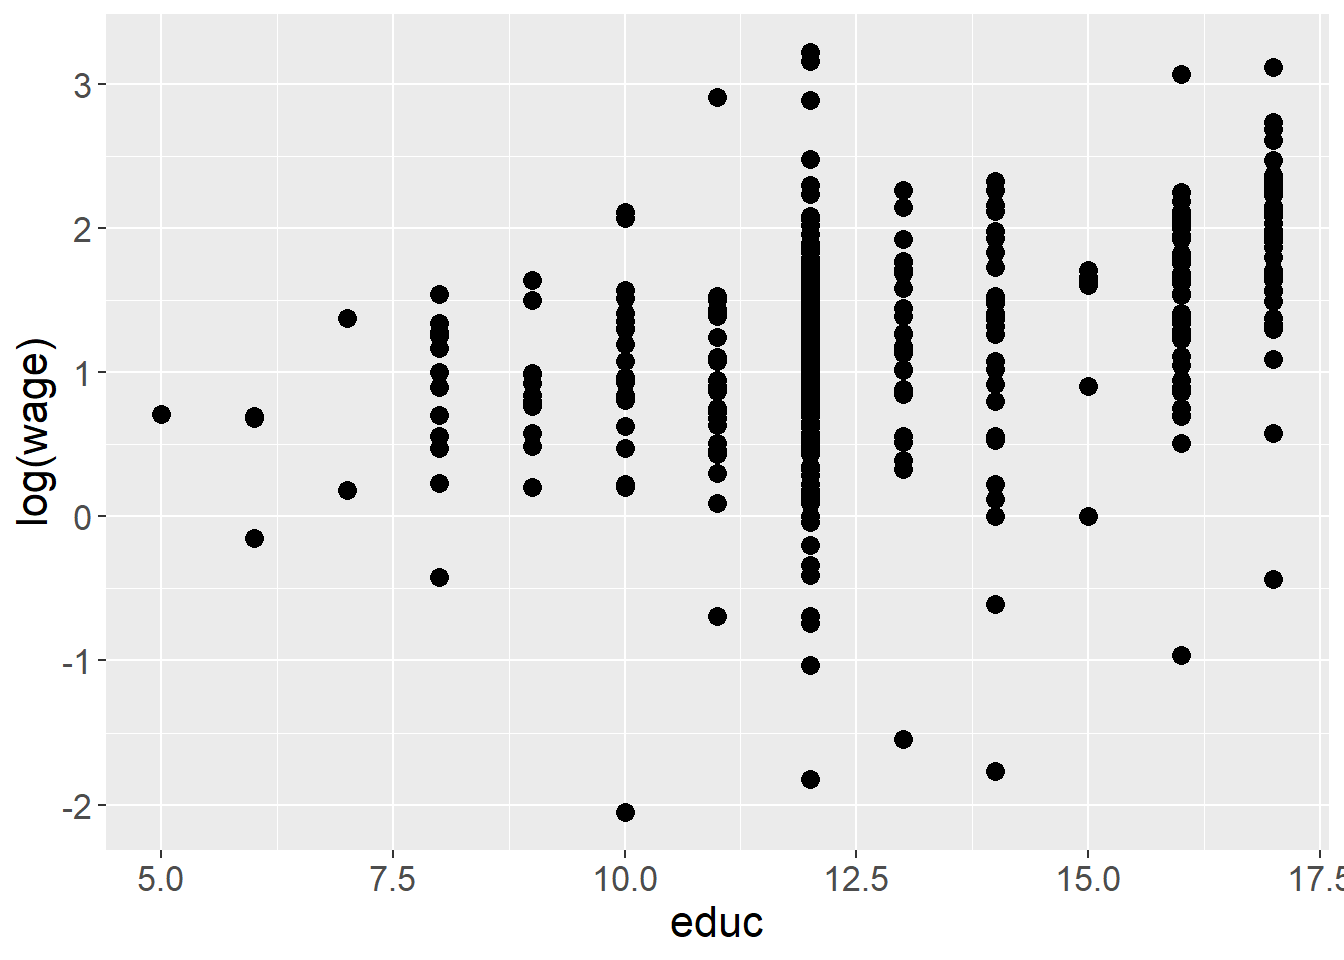
#| fig-cap: "the scatter of educ and lwage"
### ==== Wage example: the scatter ====

mroz %>%
  ggplot(aes(educ, lwage))+
  geom_point(size=3) +
  labs(x= "educ", y="log(wage)") +
  theme(text = element_text(size=16))
```
Figure 1: the scatter of educ and lwage

OLS results

```{r}
form_base <- "lwage ~ educ + exper + expersq"

fit_ols <- lm(formula = form_base,data = mroz)
summary(fit_ols)


mod_origin <- formula("lwage ~ educ +exper+expersq")
ols_origin <- lm(formula = mod_origin, 
                 data = mroz)
# summary(ols_origin)
```

Call:
lm(formula = form_base, data = mroz)

Residuals:
     Min       1Q   Median       3Q      Max 
-3.08404 -0.30627  0.04952  0.37498  2.37115 

Coefficients:
              Estimate Std. Error t value Pr(>|t|)    
(Intercept) -0.5220406  0.1986321  -2.628  0.00890 ** 
educ         0.1074896  0.0141465   7.598 1.94e-13 ***
exper        0.0415665  0.0131752   3.155  0.00172 ** 
expersq     -0.0008112  0.0003932  -2.063  0.03974 *  
---
Signif. codes:  0 '***' 0.001 '**' 0.01 '*' 0.05 '.' 0.1 ' ' 1

Residual standard error: 0.6664 on 424 degrees of freedom
Multiple R-squared:  0.1568,    Adjusted R-squared:  0.1509 
F-statistic: 26.29 on 3 and 424 DF,  p-value: 1.302e-15
```{r, results='asis'}
library("xmerit") # give you pretty equation
```
Warning: replacing previous import 'stats::filter' by 'dplyr::filter' when
loading 'xmerit'
Warning: replacing previous import 'stats::lag' by 'dplyr::lag' when loading
'xmerit'
```{r, results='asis'}
lx.out <- xmerit::lx.est(
  lm.mod = mod_origin, lm.n =2,
  opt = c("s", "t", "p"),
  lm.dt = mroz, inf = c("over","fit","Ftest"))
```

\[\begin{equation} \begin{alignedat}{999} &\widehat{lwage}=&&-0.52&&+0.11educ_i\\ &(s)&&(0.1986)&&(0.0141)\\ &(t)&&(-2.63)&&(+7.60)\\ &(p)&&(0.0089)&&(0.0000)\\ &(cont.)&&+0.04exper_i&&-0.00expersq_i\\ &(s)&&(0.0132)&&(0.0004)\\ &(t)&&(+3.15)&&(-2.06)\\ &(p)&&(0.0017)&&(0.0397)\\ &(over)&&n=428&&\hat{\sigma}=0.6664\\ &(fit)&&R^2=0.1568&&\bar{R}^2=0.1509\\ &(Ftest)&&F^*=26.29&&p=0.0000 \end{alignedat} \end{equation}\]
\[\begin{equation} \begin{alignedat}{999} &\widehat{lwage}=&&-0.52&&+0.11educ_i\\ &(s)&&(0.1986)&&(0.0141)\\ &(t)&&(-2.63)&&(+7.60)\\ &(p)&&(0.0089)&&(0.0000)\\ &(cont.)&&+0.04exper_i&&-0.00expersq_i\\ &(s)&&(0.0132)&&(0.0004)\\ &(t)&&(+3.15)&&(-2.06)\\ &(p)&&(0.0017)&&(0.0397)\\ &(over)&&n=428&&\hat{\sigma}=0.6664\\ &(fit)&&R^2=0.1568&&\bar{R}^2=0.1509\\ &(Ftest)&&F^*=26.29&&p=0.0000 \end{alignedat} \end{equation}\]

TSLS

We will use three IVs: motheduc, fatheduc, huseudc

the stage 1 model:

\[ educ = \gamma_0 +\gamma_1 exper + \gamma_1 expersqr +\theta_1 motheduc + \theta_2 fatheduc + \theta_3 huseduc + v_i \]

Weak IV test (Restricted F-test)

```{r}
#OLS estimation firstly

model_hus <- formula(educ~ exper +expersq + motheduc + fatheduc+ huseduc)

lm.hus <- lm(formula = model_hus, data = mroz)

summary(lm.hus)
```

Call:
lm(formula = model_hus, data = mroz)

Residuals:
    Min      1Q  Median      3Q     Max 
-6.6882 -1.1519  0.0097  1.0640  5.7302 

Coefficients:
              Estimate Std. Error t value Pr(>|t|)    
(Intercept)  5.5383110  0.4597824  12.046  < 2e-16 ***
exper        0.0374977  0.0343102   1.093 0.275059    
expersq     -0.0006002  0.0010261  -0.585 0.558899    
motheduc     0.1141532  0.0307835   3.708 0.000237 ***
fatheduc     0.1060801  0.0295153   3.594 0.000364 ***
huseduc      0.3752548  0.0296347  12.663  < 2e-16 ***
---
Signif. codes:  0 '***' 0.001 '**' 0.01 '*' 0.05 '.' 0.1 ' ' 1

Residual standard error: 1.738 on 422 degrees of freedom
Multiple R-squared:  0.4286,    Adjusted R-squared:  0.4218 
F-statistic:  63.3 on 5 and 422 DF,  p-value: < 2.2e-16
```{r}
library("car")
```
Warning: package 'car' was built under R version 4.3.3
Loading required package: carData
Warning: package 'carData' was built under R version 4.3.3

Attaching package: 'car'
The following object is masked from 'package:dplyr':

    recode
The following object is masked from 'package:purrr':

    some
```{r}
# restricted F-test
(constrain_test1 <- linearHypothesis(
  model = lm.hus, c("motheduc=0", "fatheduc=0", "huseduc=0")
  ))
# obtain F statistics
F_r1 <- constrain_test1$F[[2]]
```
Linear hypothesis test

Hypothesis:
motheduc = 0
fatheduc = 0
huseduc = 0

Model 1: restricted model
Model 2: educ ~ exper + expersq + motheduc + fatheduc + huseduc

  Res.Df    RSS Df Sum of Sq      F    Pr(>F)    
1    425 2219.2                                  
2    422 1274.4  3    944.85 104.29 < 2.2e-16 ***
---
Signif. codes:  0 '***' 0.001 '**' 0.01 '*' 0.05 '.' 0.1 ' ' 1

Cragg-F test

```{r}
# filter samples
mroz1 <- wooldridge::mroz %>%
  filter(wage>0, inlf==1)
# set parameters
N <- nrow(mroz1)
G <- 2 
B <- 2
L <- 2 
# for endogenous variables
x1 <- resid(lm( mtr ~ kidslt6 + nwifeinc, data = mroz1))
x2 <- resid(lm( educ ~ kidslt6 + nwifeinc, data = mroz1))
# for instruments
z1 <-resid(lm(motheduc ~ kidslt6 + nwifeinc, data = mroz1))
z2 <-resid(lm(fatheduc ~ kidslt6 + nwifeinc, data=mroz1))
# column bind
X <- cbind(x1,x2)
Y <- cbind(z1,z2)
# calculate Canonical correlation
rB <- min(cancor(X,Y)$cor)
# obtain the F statistics
CraggDonaldF <- ((N-G-L)/L)/((1-rB^2)/rB^2)
```

IV exogeneity test(over-identifiction test)

conclusion